Dashboards
System Overview
The Dashboard is the central command center for data visualization across all CAFM modules. It provides a consolidated view of operational performance using real-time statistics, dynamic charts, and flexible filters. Use it to scan what needs attention, then drill into the relevant profile or module for action.
Navigation Path:Sidebar → Dashboard
Key Capabilities
Whether you are tracking work orders, asset health, workforce efficiency, inventory usage, or contract compliance, the Dashboard surfaces the insights you need to monitor performance and take action quickly.
Dashboard Pages
Real-time overview of all work orders. Status distribution, SLA breach analytics, user satisfaction, and completion trends.
View WO Dashboard →Reactive Maintenance performance. SLA breaches, aging, time to start/complete, top contracts, and service analytics.
View RM Dashboard →Scheduled Maintenance effectiveness. Planned vs actual, status trends, SLA compliance, and completion tracking.
View SM Dashboard →Labor utilization analysis. Actual vs estimated hours, travel time, top performers, and workforce hierarchy.
View Workforce →Spare parts and consumables tracking. Utilization trends, monthly consumption, and stock availability.
View Inventory →Asset distribution and health visualization. Map view, summary cards, equipment classes, and parameter comparison.
View Assets →Financial and coverage insights. Top contracts by value, cost by coverage/type, expiry tracking, and status distribution.
View Contracts →Dashboard Descriptions
Work Orders Main Dashboard
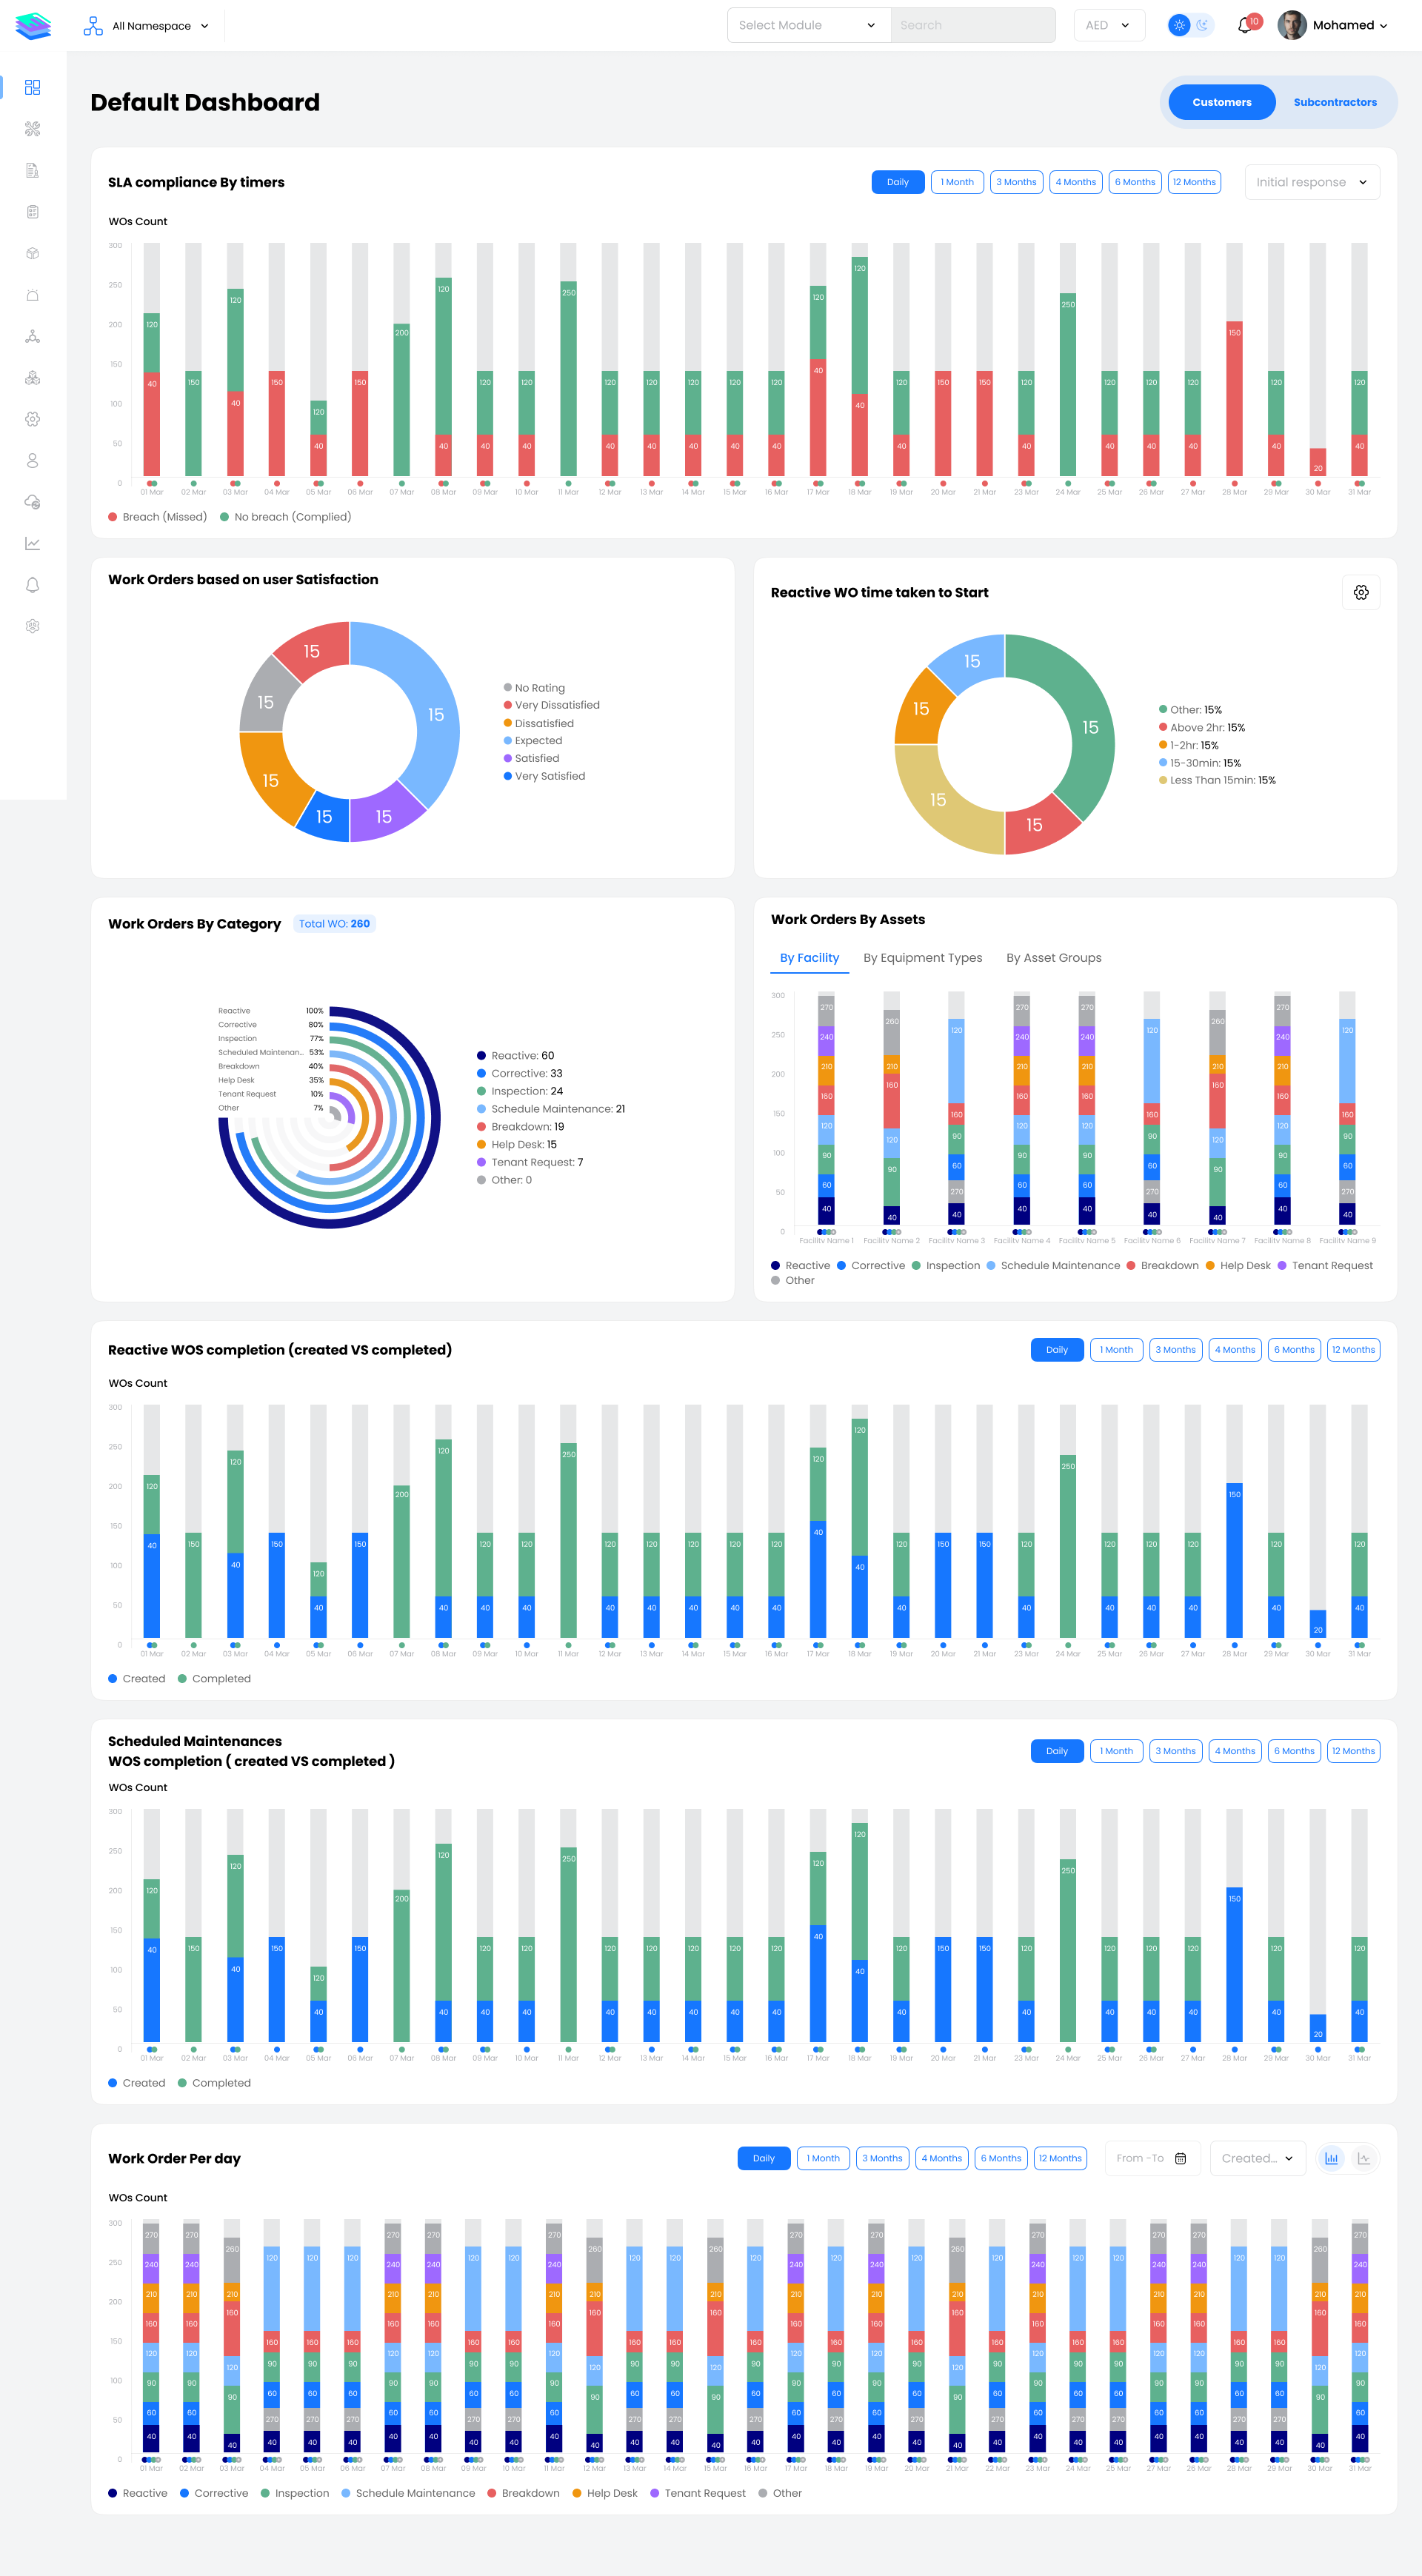
The Work Orders Main Dashboard provides a real-time overview of all work orders across your CAFM | CMMS. It displays total Work Orders and breaks them down by status—unassigned, pending, assigned, en-route, on-site, in progress, on hold, completed, closed, cancelled, offline, and repeated (genuine / not genuine).
Key Widgets:
- Status tiles for every stage of the work order lifecycle
- SLA Breach Overview with compliance metrics
- Work Orders by Category (SM, Reactive, Inspection, Corrective, etc.)
- User Satisfaction distribution
- Reactive vs Scheduled Completion trends
- Work Orders by Assets (Facility, Equipment Type, Asset Groups)
Work Orders RM Dashboard
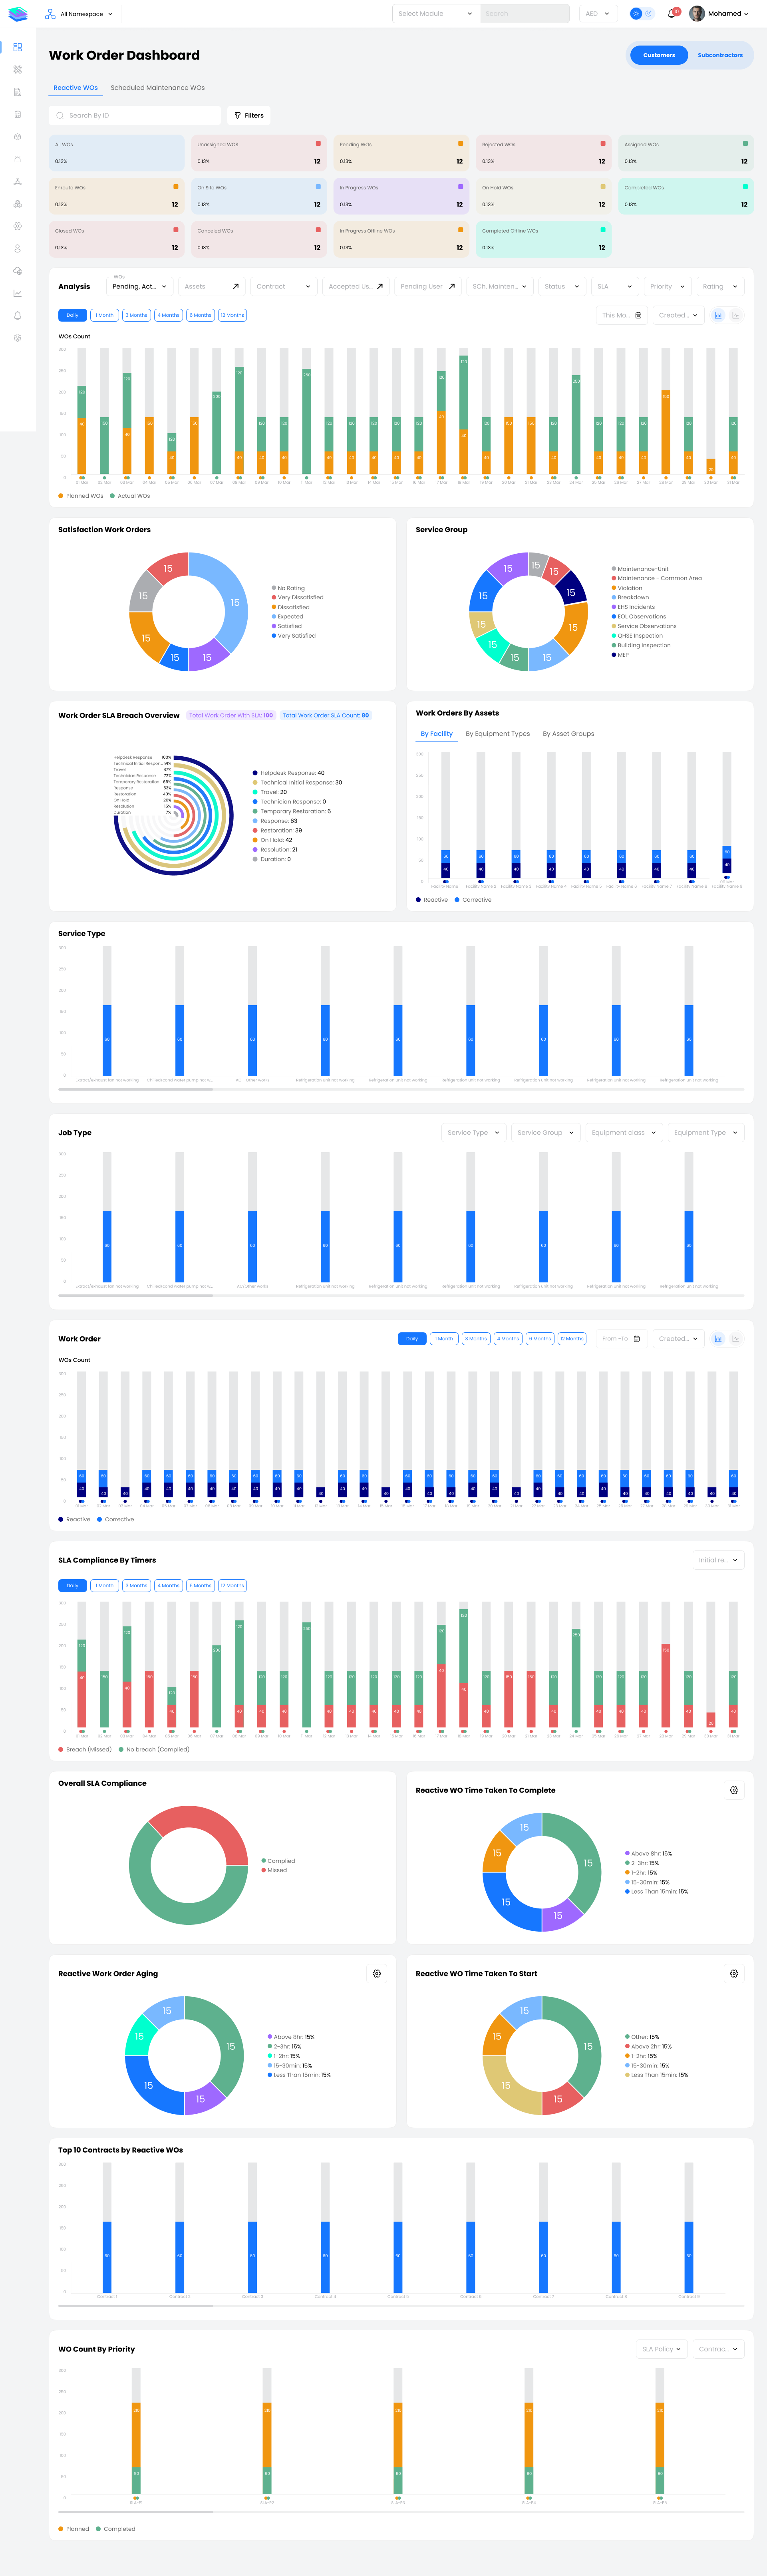
The Work Orders RM Dashboard focuses on Reactive Maintenance performance. It highlights SLA breach analytics (total Work Orders with SLA, total breached, breach count, and overall compliance), and key RM KPIs such as reactive Work Order aging, time taken to start, and top contracts by reactive Work Orders.
Key Widgets:
- RM status tiles and trend analysis
- SLA Compliance Trend (Breach vs No Breach)
- Time Taken To Complete / Time Taken To Start
- Reactive Work Order Aging
- Top 10 Service Types and Jobs
- Top 10 Contracts by Reactive Work Orders
- SLA Compliance by Priority
Work Orders SM Dashboard
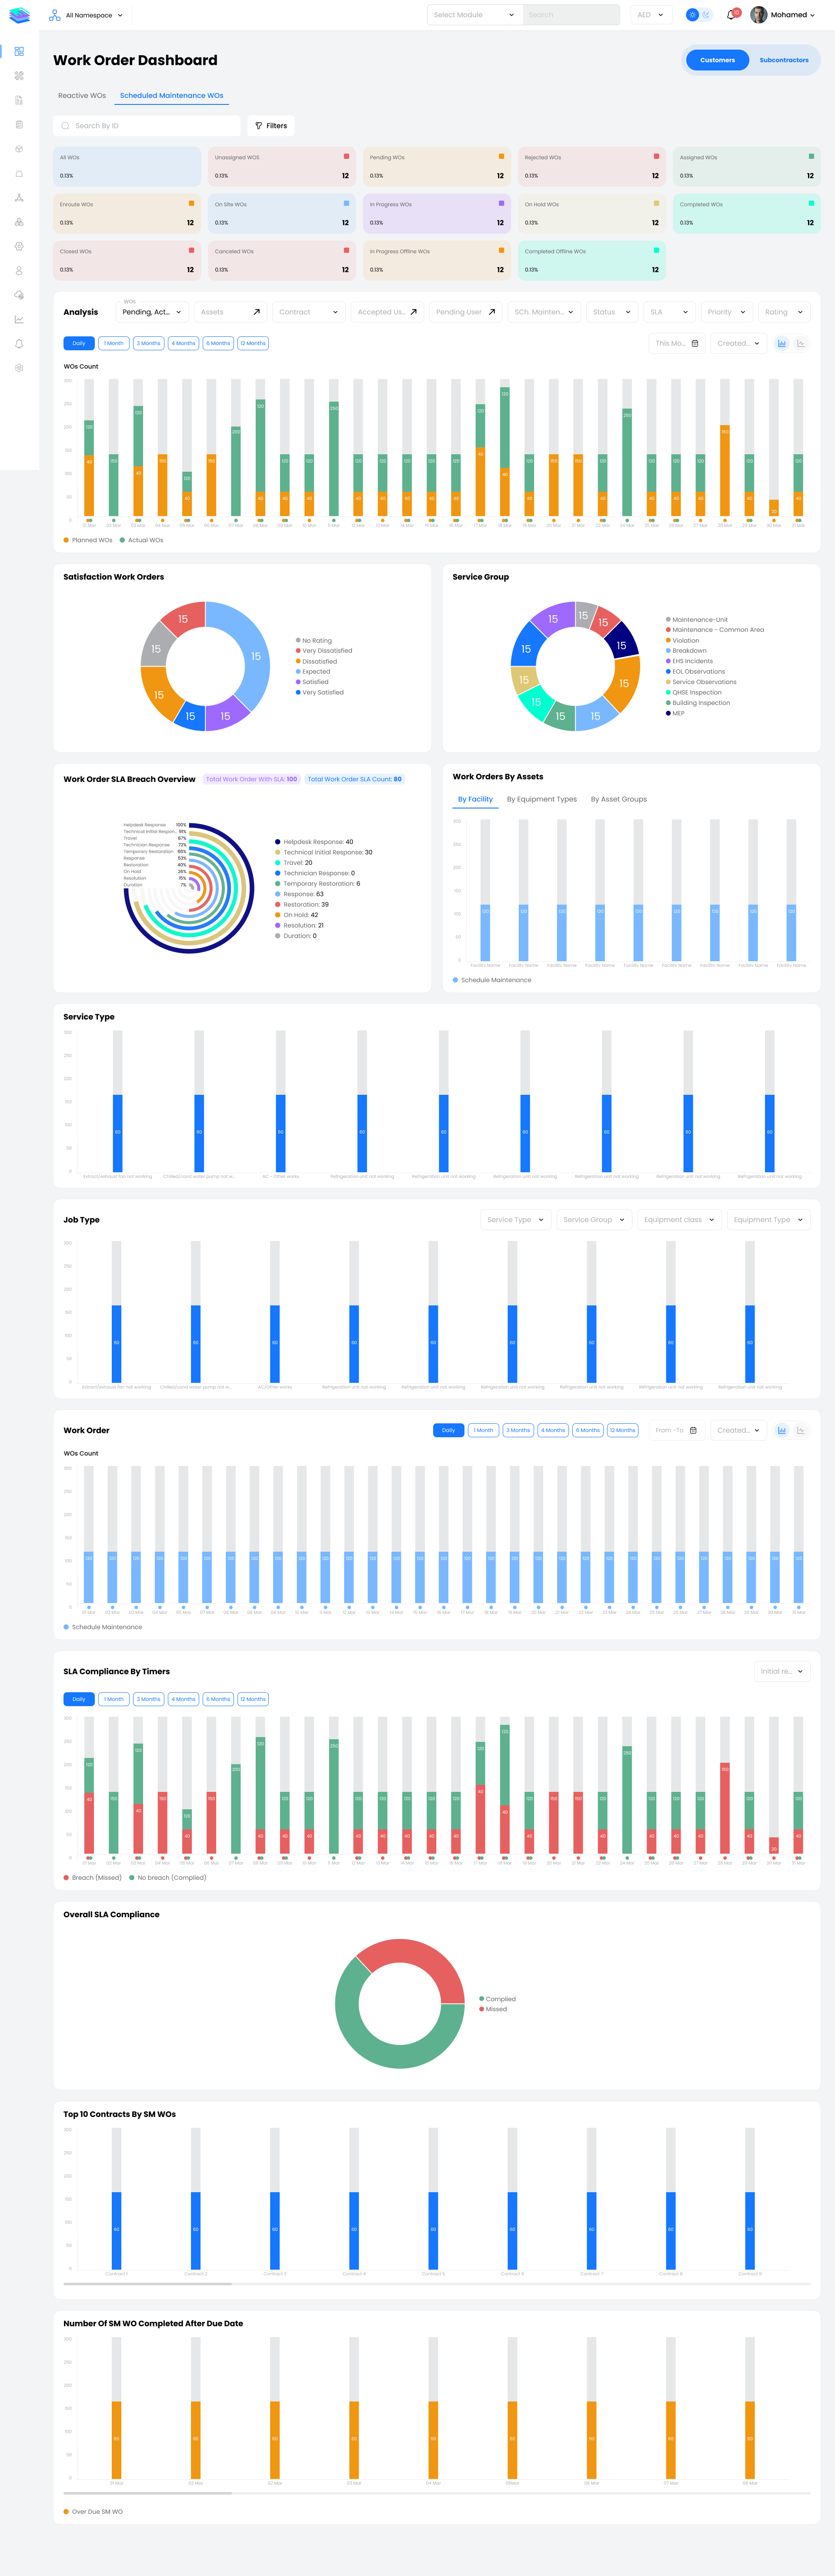
The Work Orders SM Dashboard provides visibility into Scheduled Maintenance effectiveness. It tracks planned vs actual SM work orders over time, showing status trends by day or selected period.
Key Widgets:
- SM status tiles
- Number of WO Completed After Due Date
- Work Orders by Assets
- User Satisfaction
- Service Group, Type, Job analytics
- SLA Breach Analysis
- Schedule Maintenance Status Trend (Planned vs Actual)
Workforce Dashboard
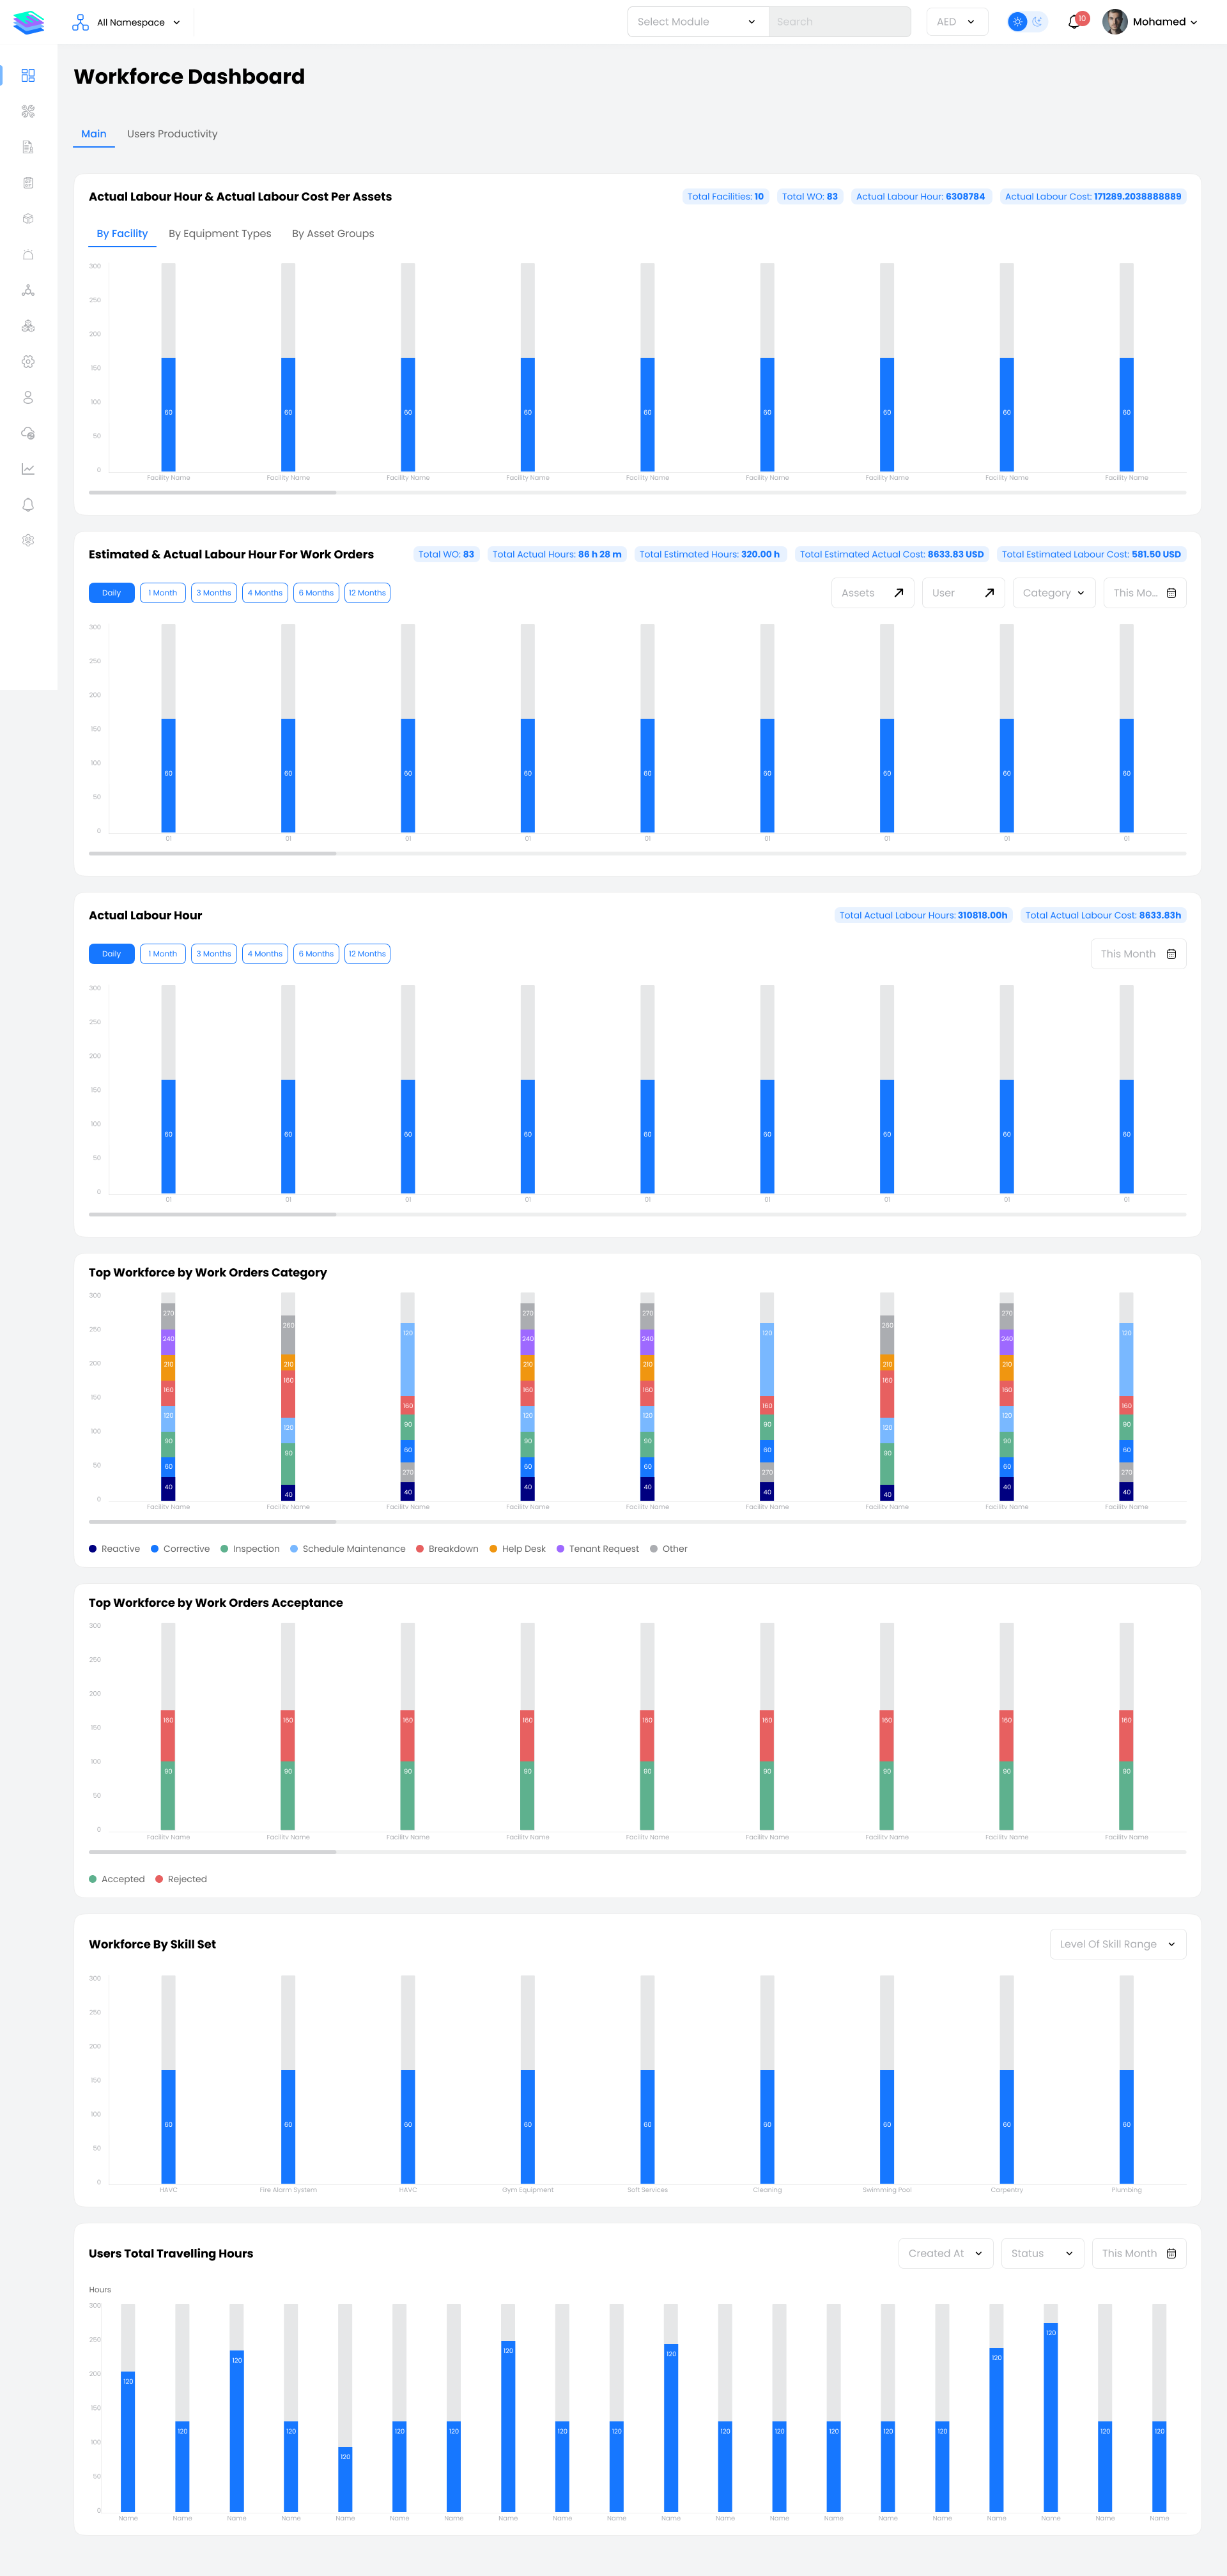
The Workforce Dashboard enables you to analyze labor utilization across facilities and assets. It shows actual labour hours and labour cost per asset, facility, equipment type, or asset group, as well as estimated vs actual labour hours and costs for selected periods.
Key Widgets:
- Actual Labour Hours & Cost per Assets
- Estimated vs Actual Labour Hours
- Travel Hours analysis
- Top Workforce by Work Order Category
- Top Workforce by Work Order Acceptance
- Users Tree (Workforce Hierarchy)
Inventory Dashboard
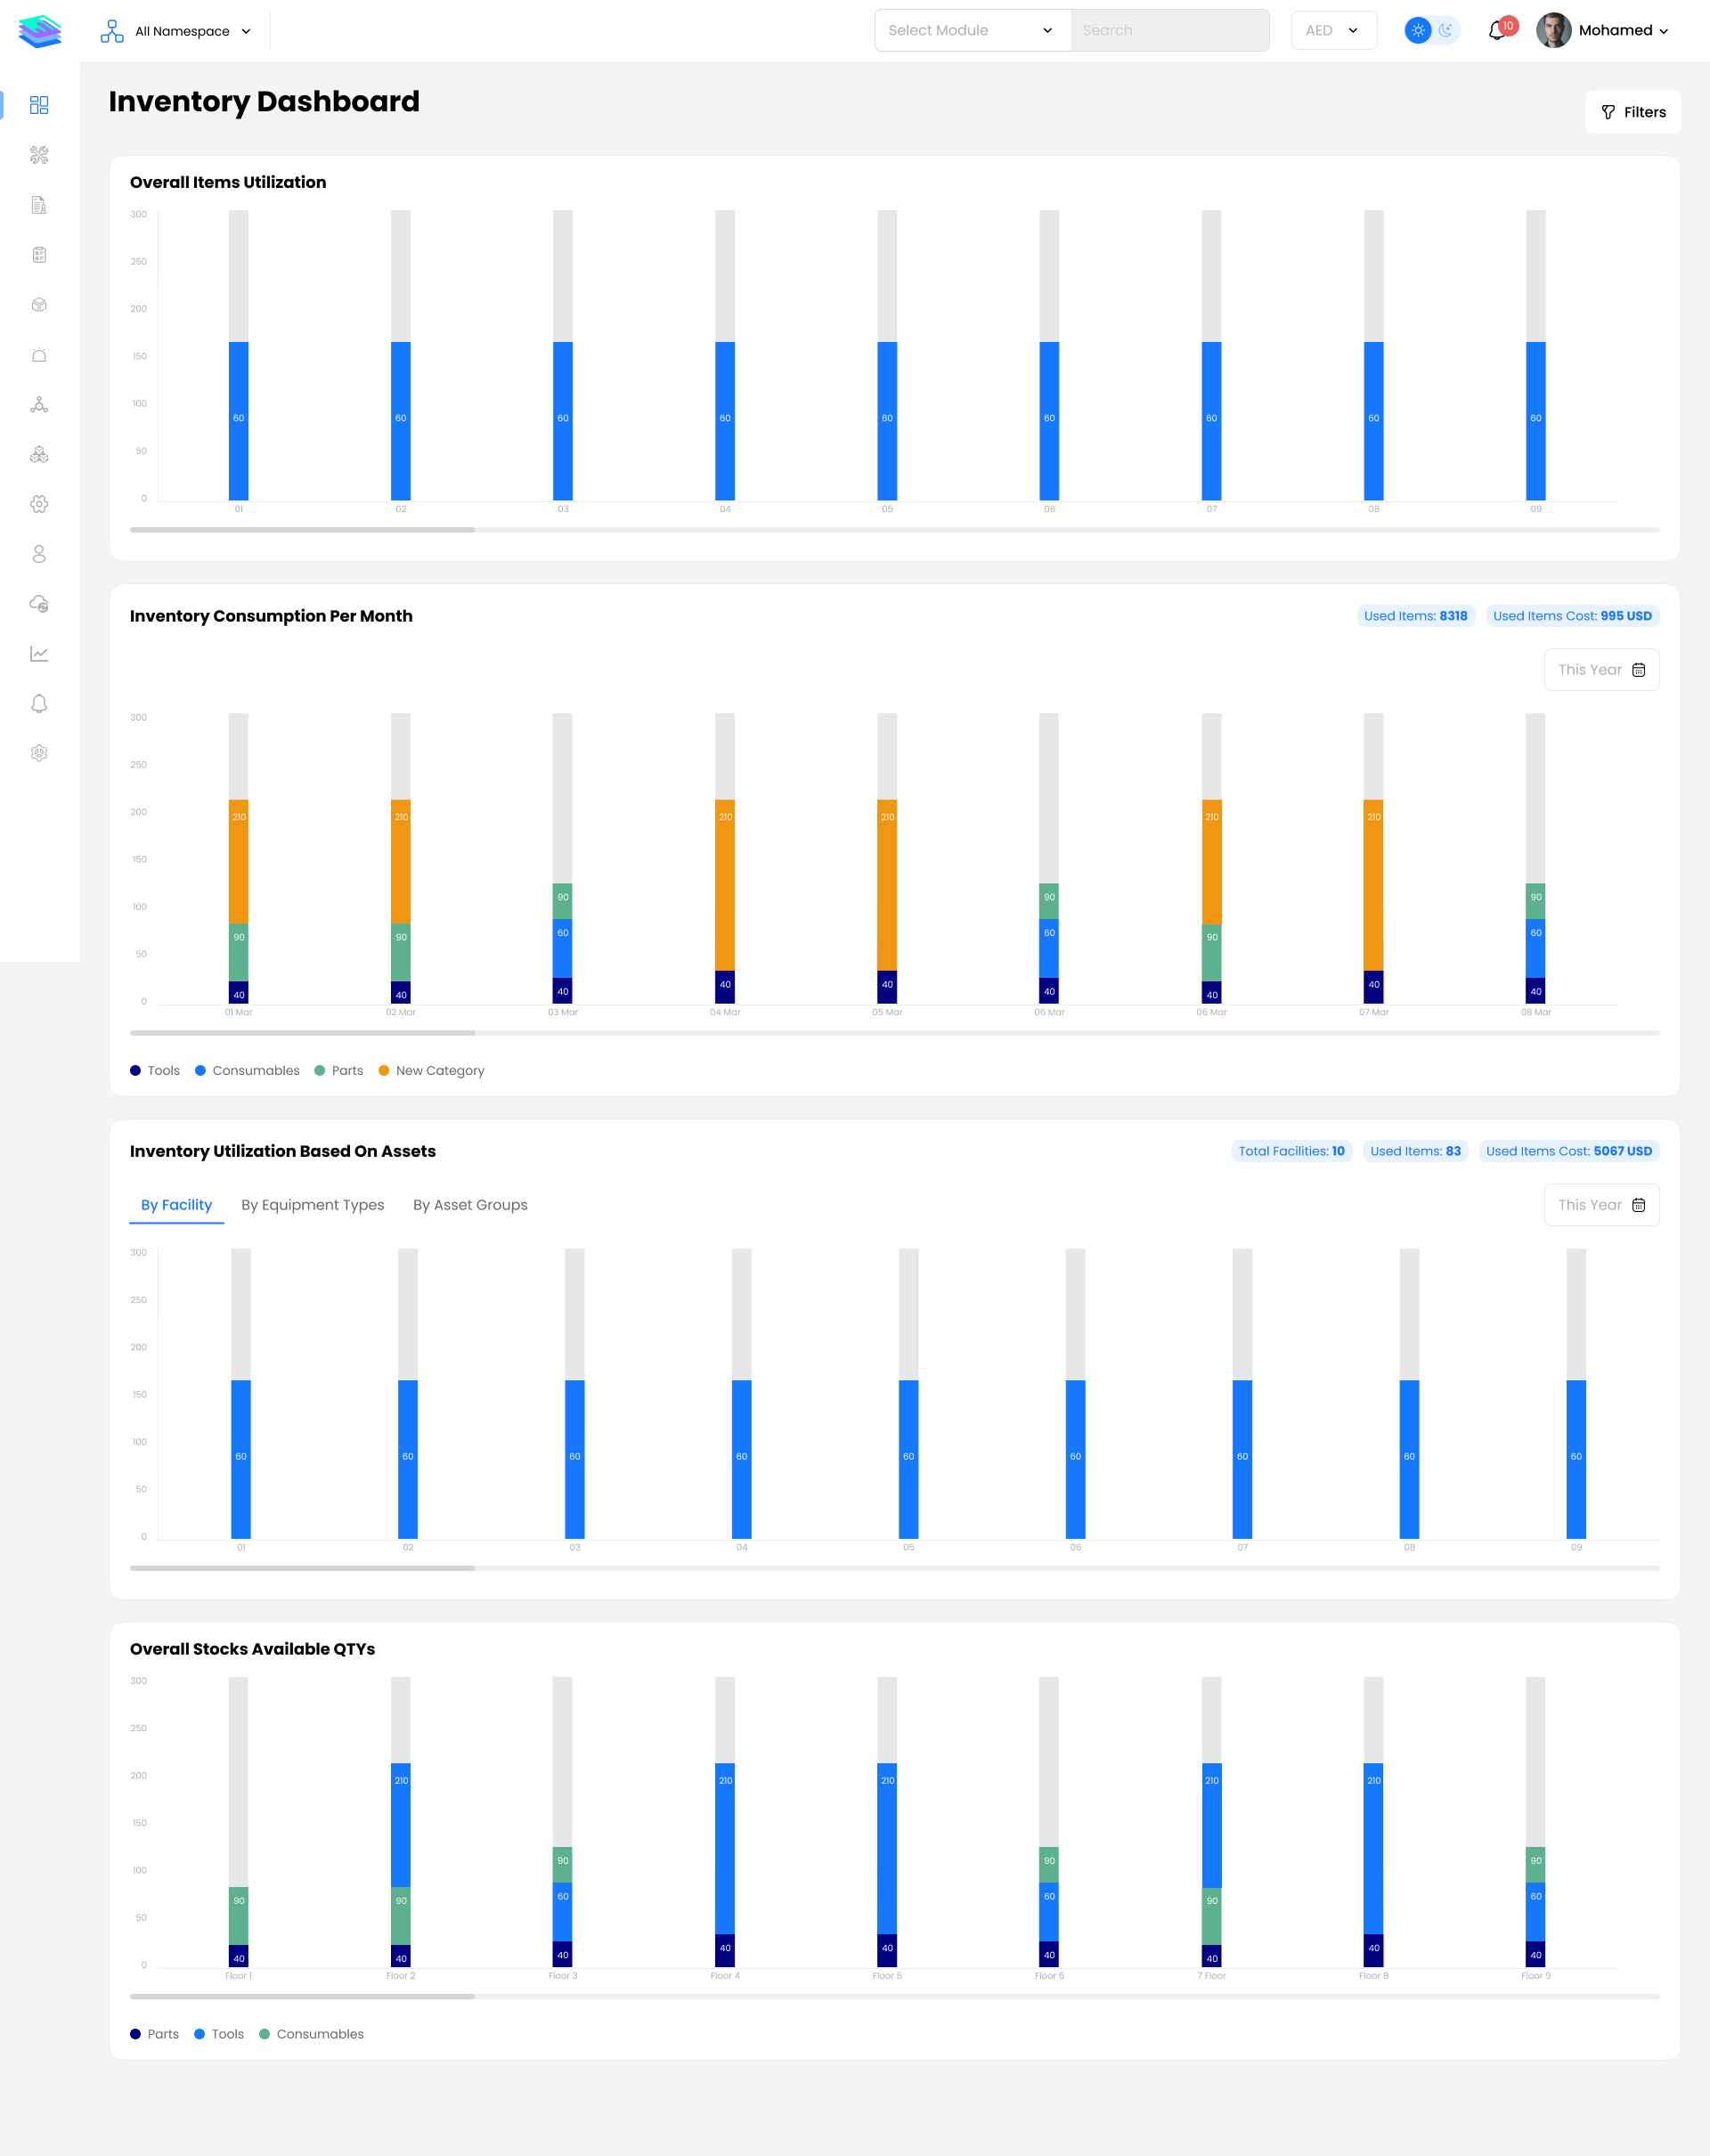
The Inventory Dashboard allows you to track spare parts and consumables usage across your operations. It shows overall item utilization, monthly inventory consumption, and the cost of used items, broken down by item categories.
Key Widgets:
- Overall Items Utilization trend
- Inventory Consumption Per Month
- Inventory Utilization Based on Assets
- Overall Stocks Available Quantities
Assets Dashboard
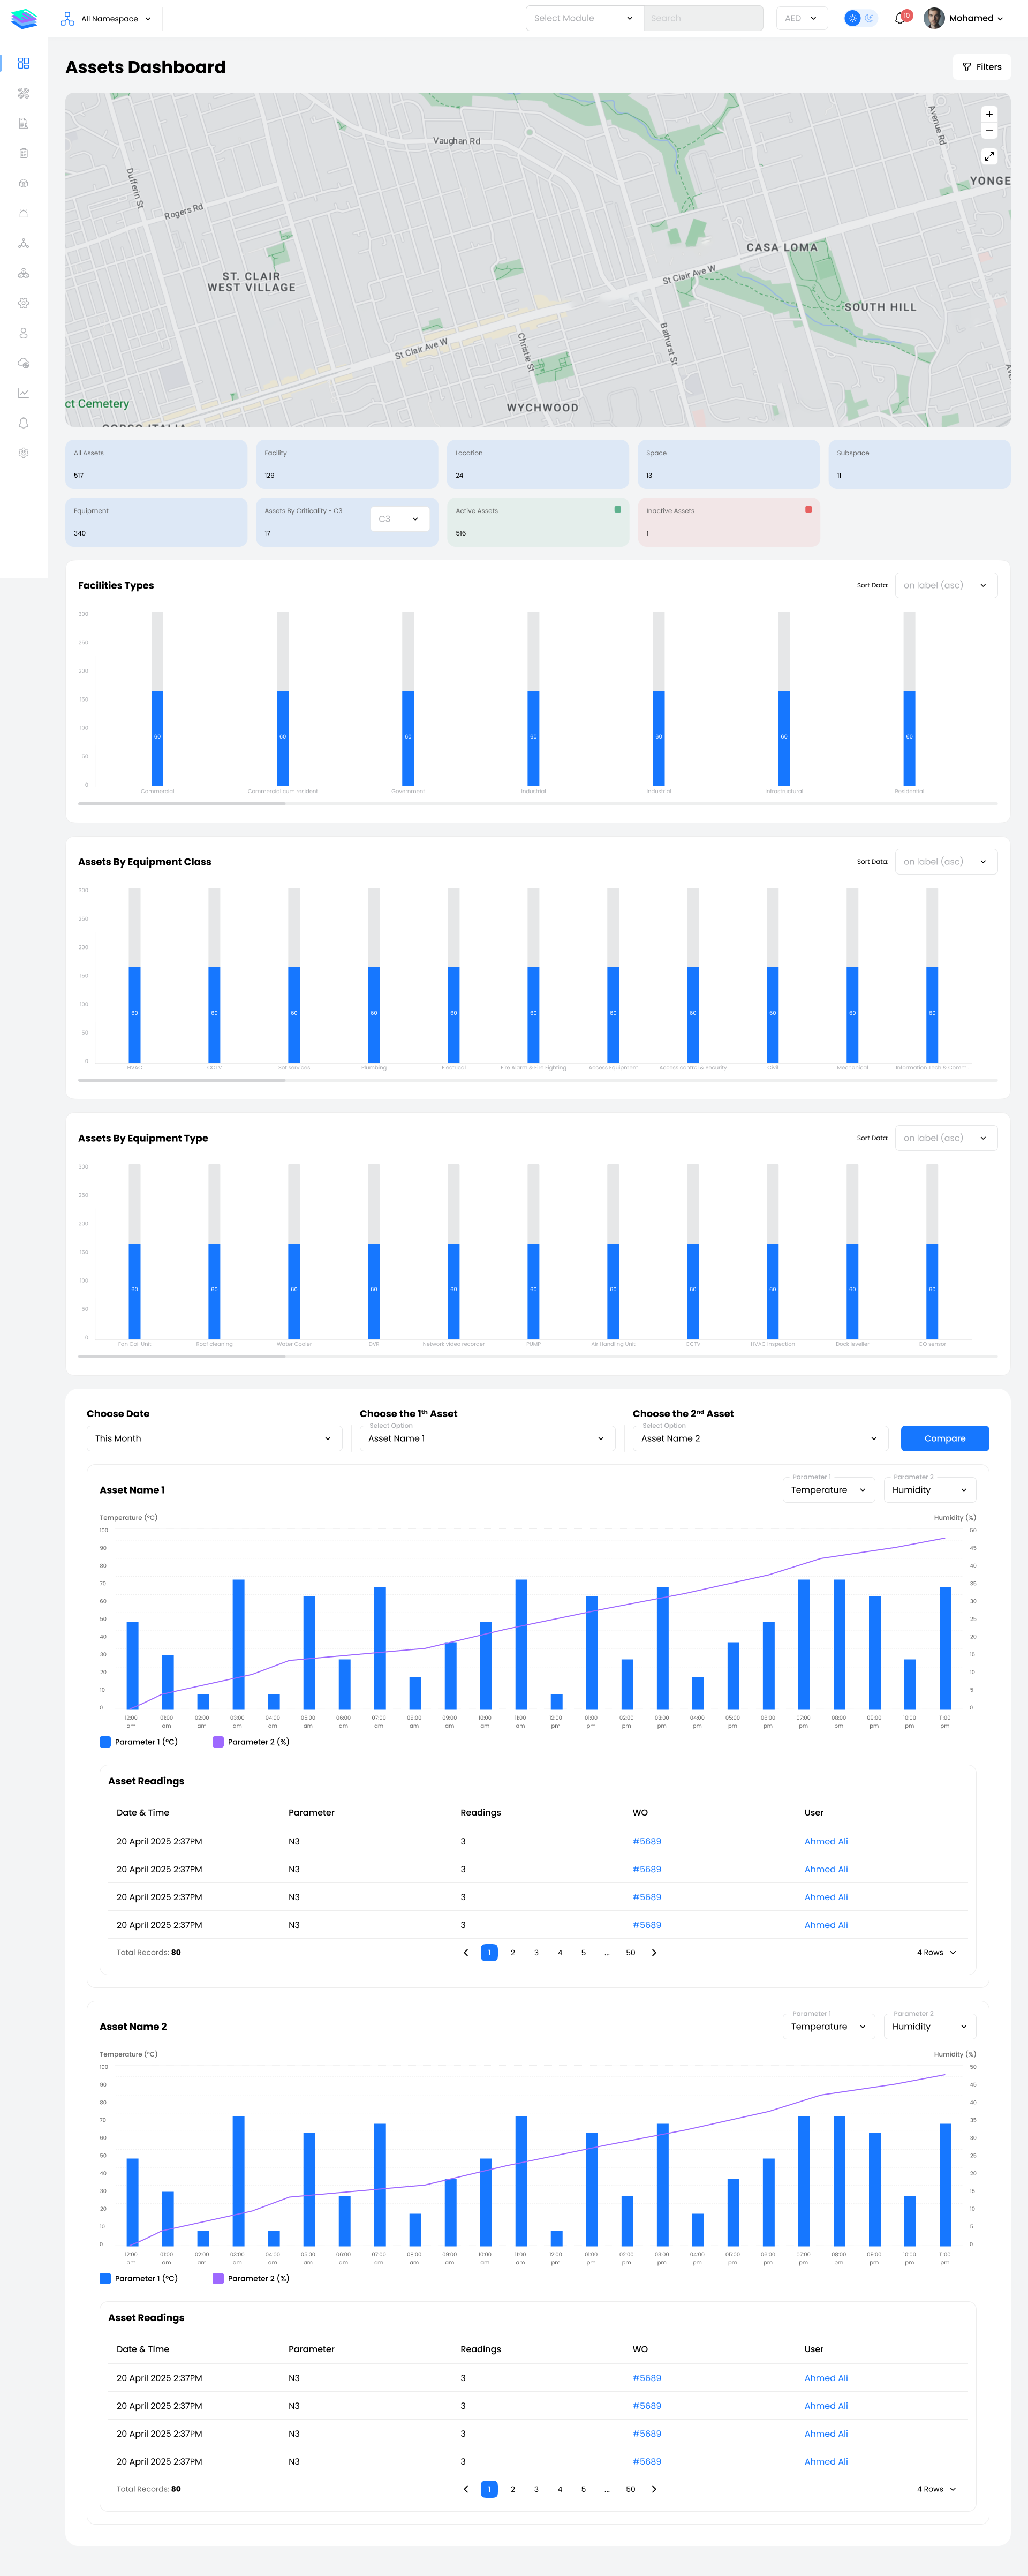
The Assets Dashboard helps you visualize asset distribution and health across all facilities. A map view displays asset locations, while summary tiles show total assets, facilities, locations, spaces, subspaces, equipment counts, active vs inactive assets, and assets by criticality level.
Key Widgets:
- Assets Map View
- Summary Cards (counts by type)
- Facility Type Distribution
- Assets by Equipment Class
- Assets by Equipment Type
- Assets Parameter Comparison Chart
Contracts Dashboard
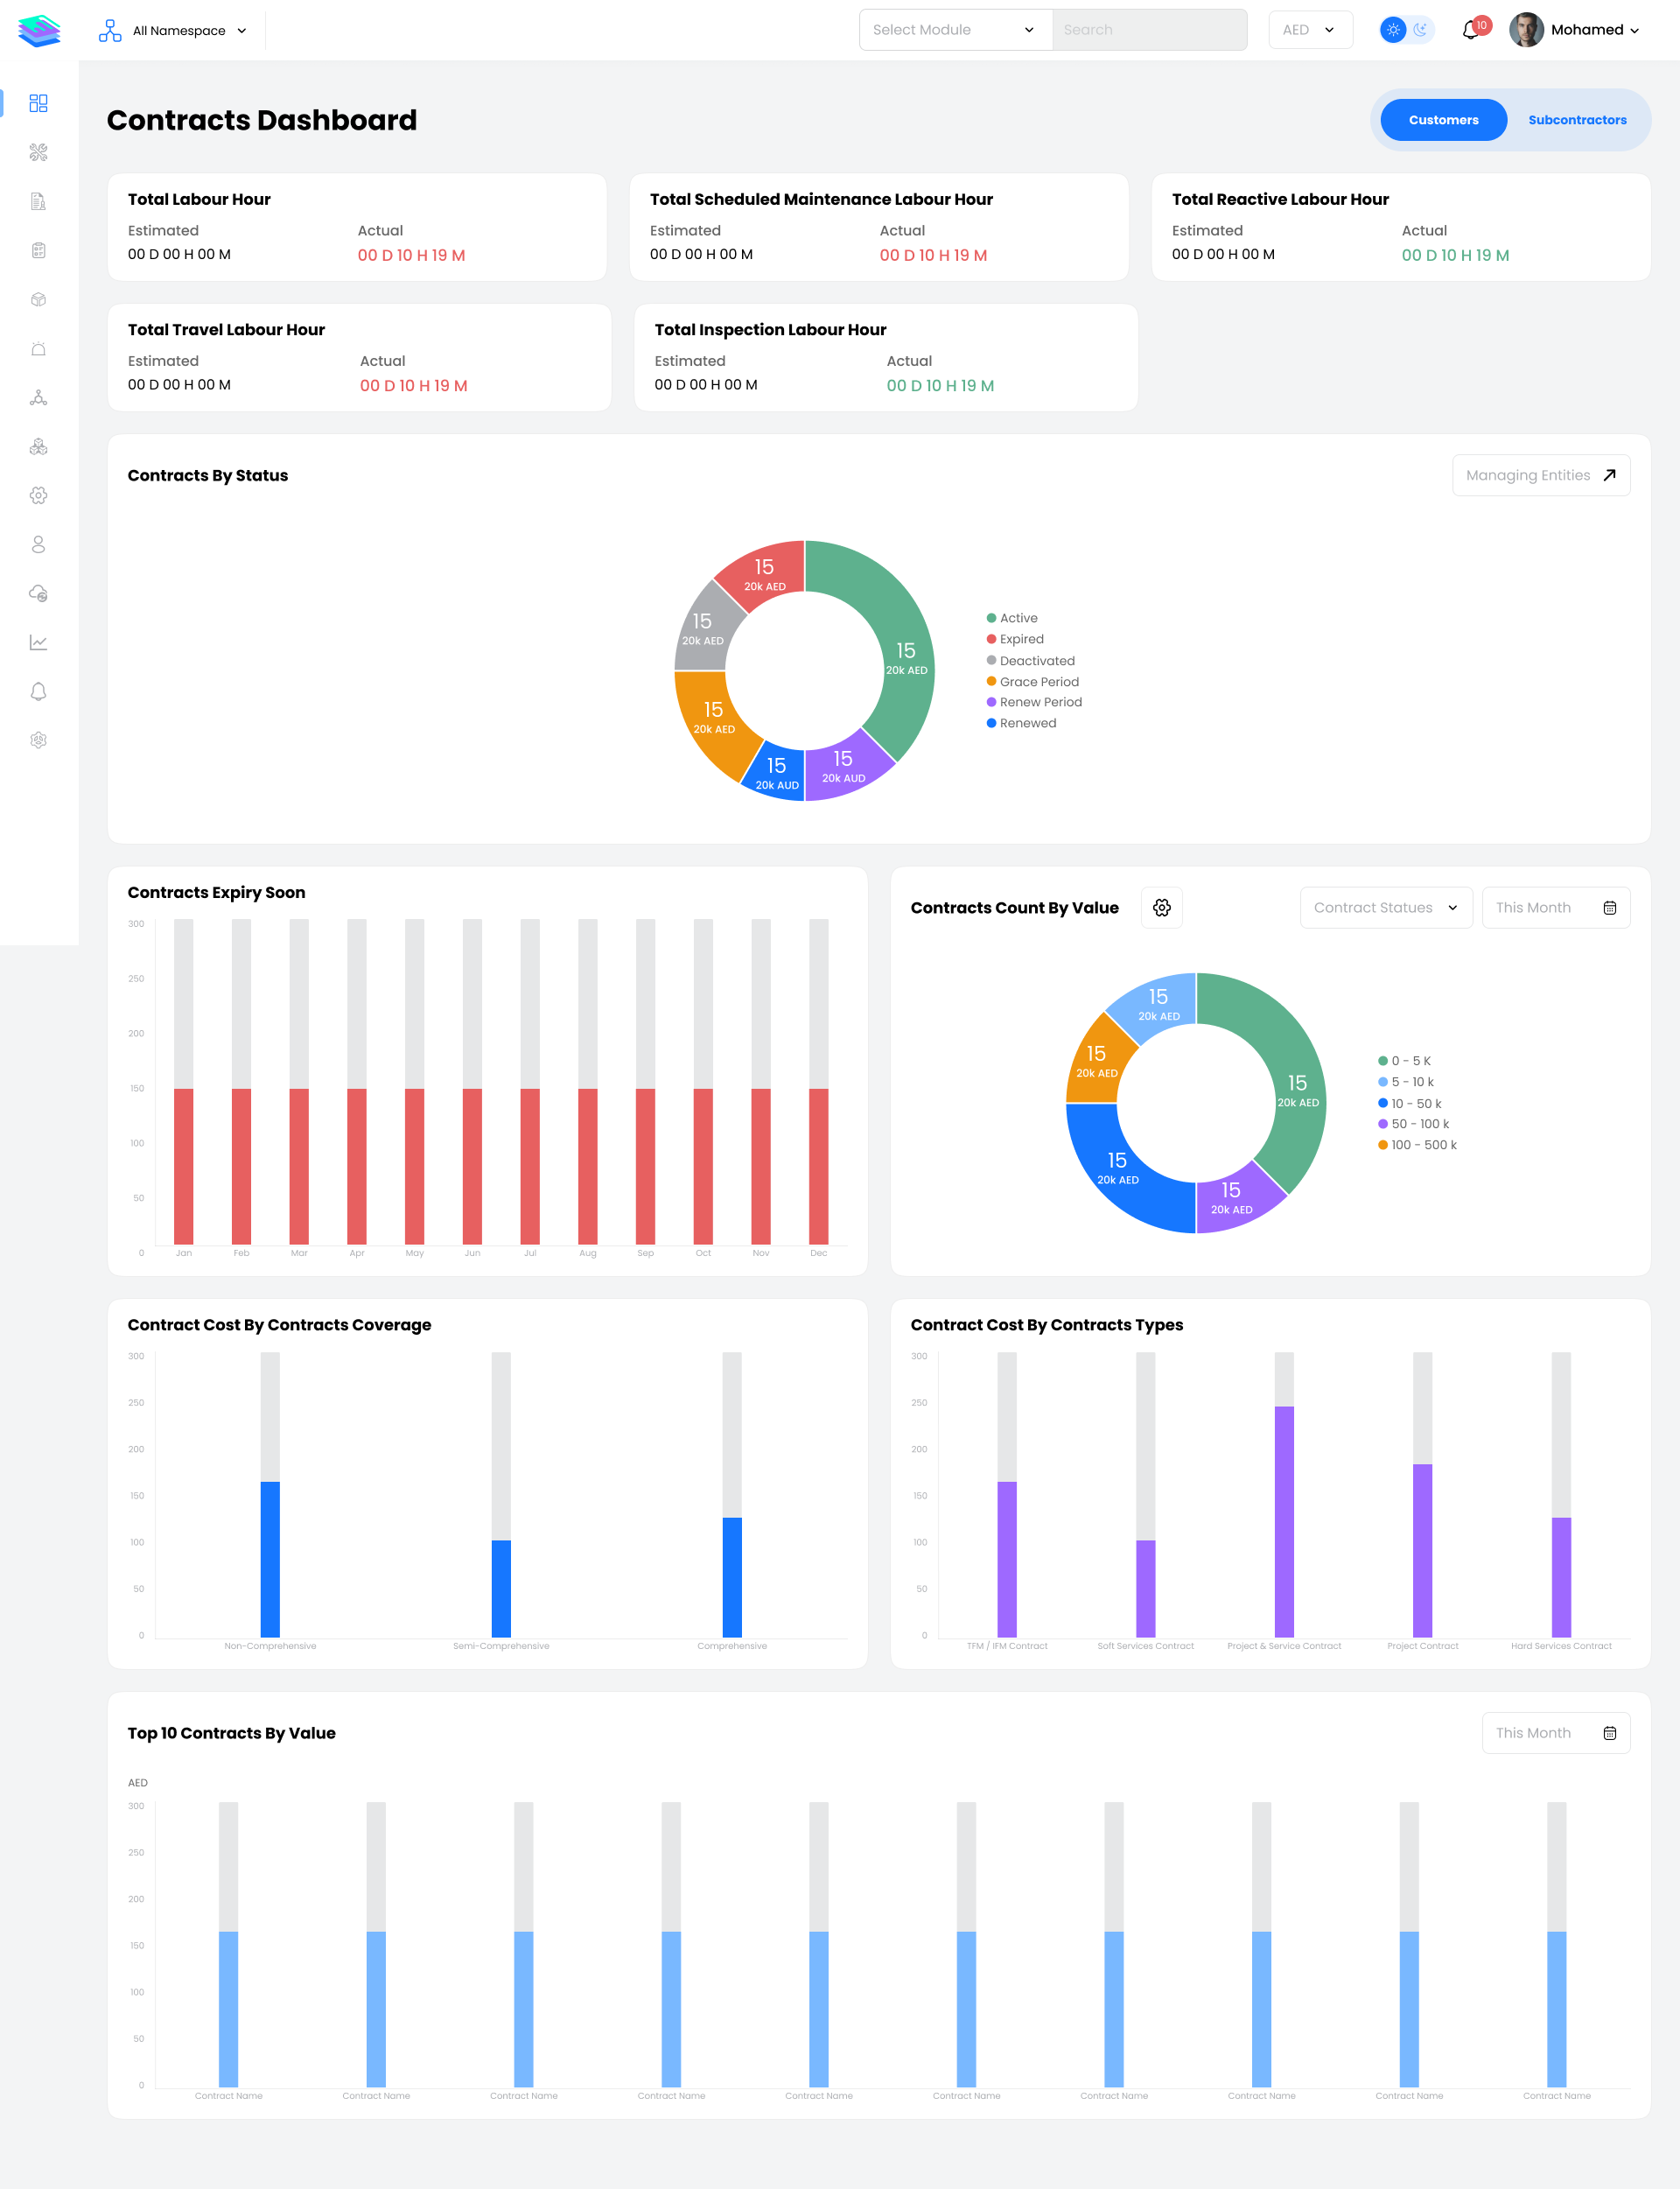
The Contracts Dashboard provides financial and coverage insights for all active maintenance and service contracts. It highlights the top contracts by value and breaks down contract cost by coverage type and contract type.
Key Widgets:
- Top 10 Contracts by Value
- Contract Cost by Coverage (Comprehensive, Semi-Comprehensive, etc.)
- Contract Cost by Contract Type
- Contracts Expiry Soon
- Contract Count by Status
- Contracts Count by Value (Custom Ranges)
Persona Use Cases
Facility Manager / Operations Manager
- Monitors overall operational health through status tiles and trends
- Identifies bottlenecks and SLA breaches requiring immediate attention
- Reviews asset distribution and workforce performance
Maintenance Planner / Supervisor
- Tracks work order completion rates and backlog
- Monitors scheduled maintenance compliance
- Analyzes top service types and recurring issues
Contract Manager / Finance
- Reviews contract values, coverage types, and expiry timelines
- Analyzes cost distribution across service categories
- Validates SLA performance against contractual commitments
Senior Management / Executive
- Gets high-level KPIs and performance summaries
- Reviews compliance and customer satisfaction trends
- Supports strategic decision-making with data insights
Key Notes
Filters & Time Ranges
All dashboards support flexible filtering by period (daily, weekly, monthly, quarterly, yearly), facility, contract, service group, and more. Use filters to focus on specific areas or compare performance across different scopes.
Real-Time Data
Dashboard widgets display real-time or near-real-time data. Refresh the page or use auto-refresh settings to ensure you're viewing the latest information.
Drill-Down Capability
Most widgets allow drill-down into detailed views. Click on chart segments, bars, or tiles to navigate to the underlying work orders, assets, or contracts.
Export & Share
Dashboard data can typically be exported to CSV or PDF for reporting, sharing with stakeholders, or offline analysis.
Best Practices
- Start each day with a quick scan of status tiles to identify urgent items
- Use trend charts to spot patterns and predict future workload
- Review SLA compliance regularly to prevent breaches before they occur
- Compare actual vs estimated metrics to improve planning accuracy