Reports
The Reports module allows users to build printable, visual reports containing dashboards and charts from across the system — including SLA compliance, daily work orders, contract metrics, leave approvals, and more.
Navigation: Sidebar → Reports
Overview
Reports in ALEF 360° enable you to create customized, printable documents that combine charts, tables, and metrics from various system modules. Reports can be exported as PDFs for distribution to stakeholders.
| Feature | Description |
|---|---|
| Visual Charts | Include charts from dashboards across the system |
| Work Order Tables | Add filtered tabular data from the Work Orders module |
| Multi-Page Layout | Create reports with multiple pages |
| Drag-and-Drop | Arrange and resize elements freely |
| PDF Export | Download reports as printable PDF documents |
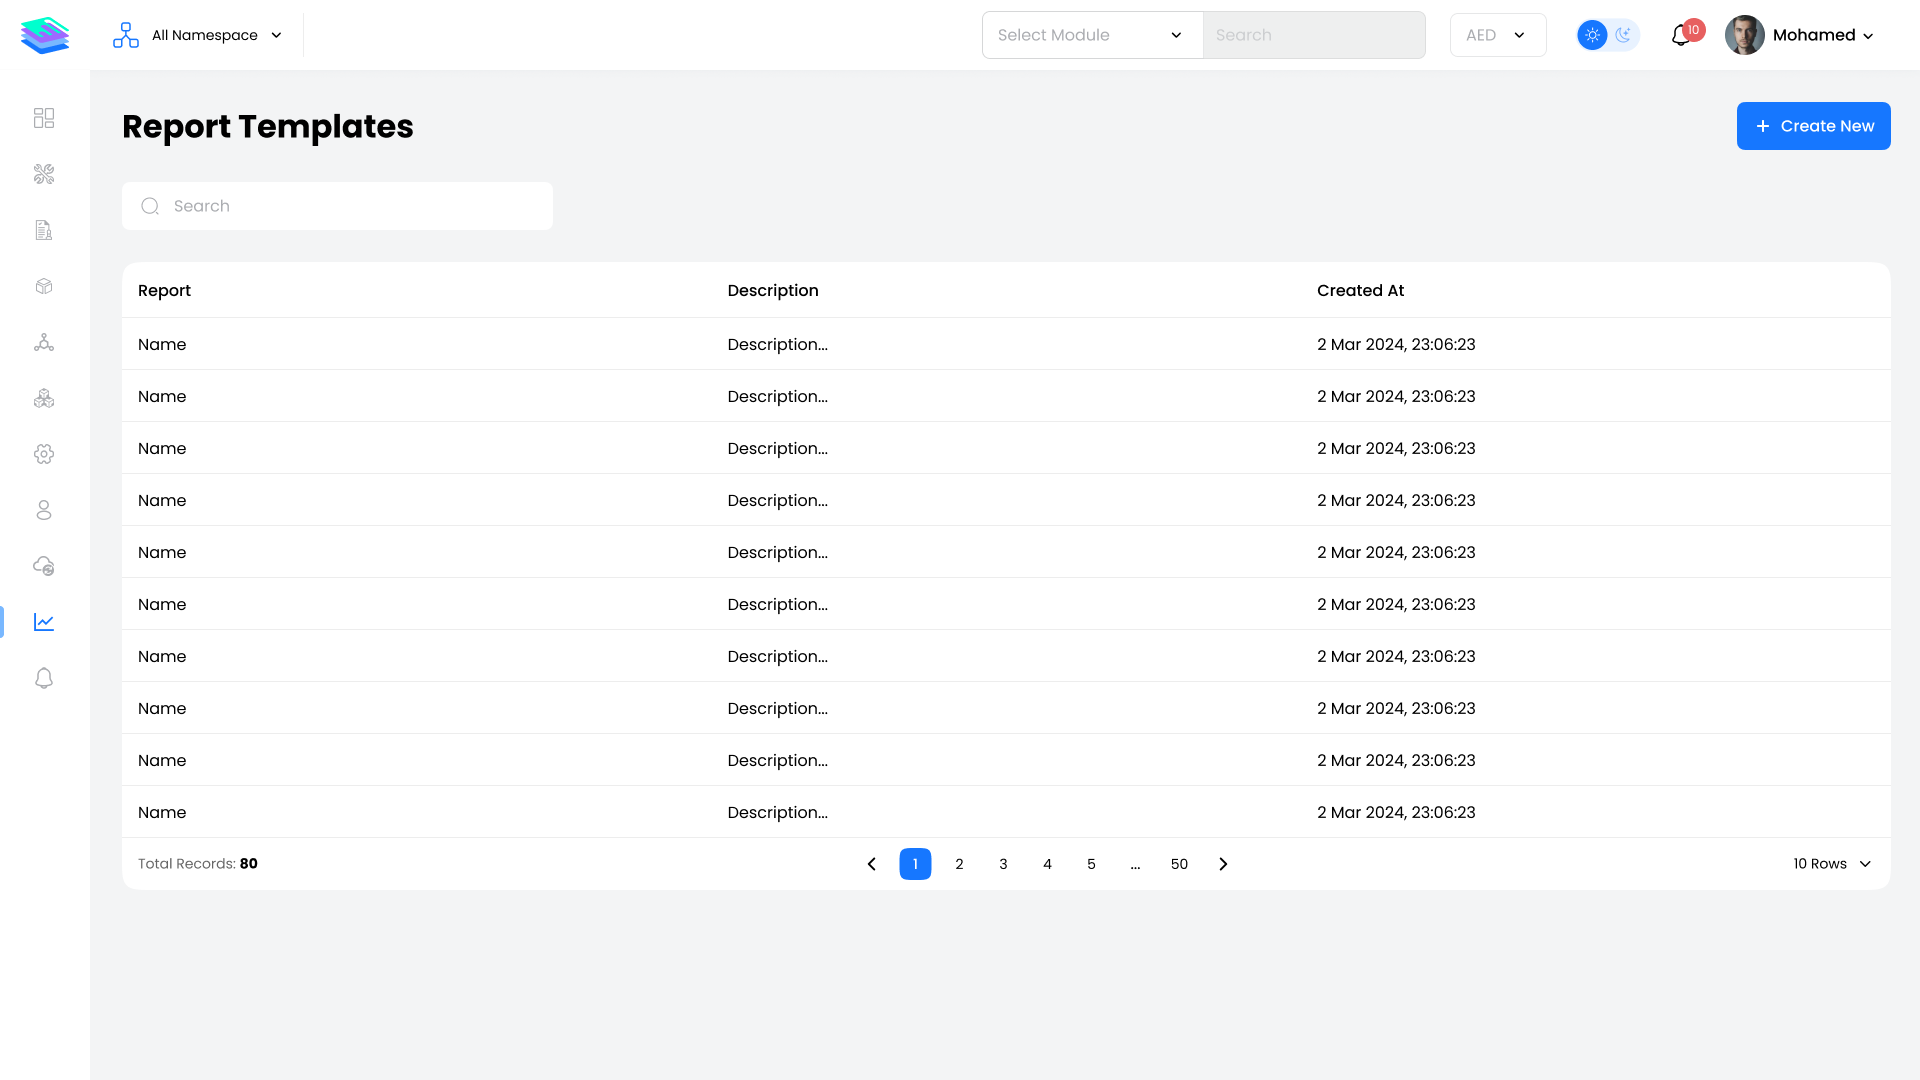
Report List View
The main Reports page displays all existing reports in a table format.
Available Actions:
| Action | Description |
|---|---|
| View | Open report details and preview pages |
| Edit | Modify report layout, charts, and settings |
| Delete | Remove a report (with confirmation) |
| Create New | Add a new report |
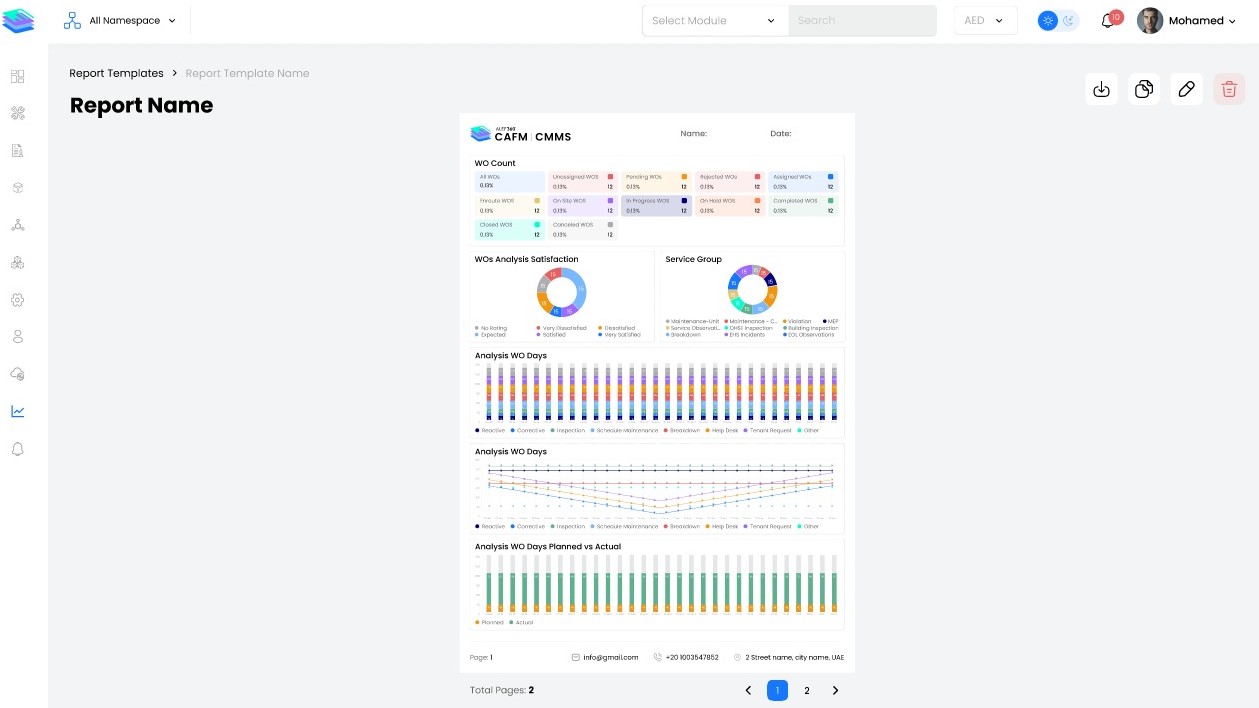
Report Profile
Click on any report name to view its full profile. Each report consists of one or more pages containing charts and widgets.
Profile Actions:
| Action | Description |
|---|---|
| View Pages | Browse through report pages |
| Download PDF | Export the report as a PDF file |
| Edit | Modify the report layout |
| Delete | Remove the report |
Report Types
ALEF 360° supports two types of report content:
Charts
Visual representations pulled from platform dashboards:
| Chart Category | Examples |
|---|---|
| SLA Compliance | Response time adherence, resolution rates |
| Work Orders | Daily counts, status distribution, trends |
| Contract Metrics | Performance by contract, coverage analysis |
| Leave Management | Approvals, rejections, pending requests |
Work Order Tables
Filtered tabular views from the Work Orders module with options to:
| Filter | Description |
|---|---|
| Status | Filter by work order status |
| Category | Filter by work order category |
| Date Range | Filter by time period |
| Technician | Filter by assigned technician |
Quick Start Guide
- Navigate to Reports — Access the Reports module from the sidebar
- Create New Report — Click the Add button to start
- Enter Details — Provide report name, description, and contact info
- Select Report Type — Choose Charts or Work Order Table
- Add Content — Drag and drop elements onto the page
- Customize Layout — Resize and arrange elements
- Save and Export — Save changes and download as PDF
Page Layout
Each report page supports flexible layout management:
| Feature | Description |
|---|---|
| Add Charts | Insert new chart blocks onto the page |
| Resize | Drag edges to resize any element |
| Reposition | Drag elements to new locations |
| Remove | Delete unwanted elements |
| Multi-Page | Add additional pages as needed |
Edit Mode
When editing a report, the following tools are available:
| Tool | Description |
|---|---|
| Add Block | Insert new chart or table blocks |
| Edit Title | Rename chart titles |
| Reset | Restore default chart name |
| Resize | Adjust element dimensions |
| Reposition | Move elements within the page |
| Delete | Remove elements from the layout |
| Save | Commit all changes |
| Cancel | Discard unsaved changes |
Key Notes
- Reports can contain multiple pages with different chart combinations
- All charts are interactive during editing but static in exported PDFs
- Work Order Tables respect your current filter permissions
- Reports are saved automatically when you click Save Changes
- PDF exports include all pages in the report
- Use meaningful names and descriptions for easy identification